Vote fraud theory: Hammer, Scorecard, and NY Times json files
background
I've been presented with another theory of fraud in the 2020 Presidential election. Have a
look at the video, which compares snapshots of the election results as extracted from NY Times .json
files to "prove" that votes were switched and lost. This is done via some python
code we'll take a look at below. The video walks through this Natural News post in a very
lively and shout-splaining fashion. Bold claims are made, including:
- NY Times
.jsonfiles are analogous to a "Flight Data Recorder (black box)" when it comes to being official transaction logs of election night results - over 500k votes were switched from Trump to Biden
- Bannon and Giuliani have confirmed whistleblowers from Dominion, a ballot counting software company (that was on 11/11; the pattern is always the same: dangle some mind-blowing tidbit and then we never hear about it again? Nevertheless, for weeks I'll hear people citing "those Dominion whistleblowers they found")
- a fraud simulator (spoiler: it just switches key states when you toggle between fraud and no fraud scenarios, with no explanation of how it's calculating anything at all)
- Trump and DoD personnel watched this fraud happen in real time, have it recorded, and allowed the fraud to happen so they'd have proof (but still filed lawsuits in five states, just to withdraw from two)
In any case, we'll be focused on the data analysis and short answer: no, there's nothing here folks.
explanation
The gist of the theory is simple:
- the NY Times stores the data from its live election night updates in json files
- a person on the internet downloaded those and found irregularities
- because the files must be ground truth, tied directly to ballot counting machines via infallible link, these irregularities imply fraud
There are two key legs this theory stands on. The first is a huge leap, in my opinion, that the NY Times data is to be treated as ground truth for anything. The news page adds some handwaving "truth boost" to this that the data is from Edison Research, also used by many news organizations… but again, where do they get it? Why do we think that Edison Research somehow equals "wired into the mainframe" here? Other sources on election night were wrong and had to be corrected, why are these magical .json files infallible?
Even the author of this code admits to fatal flaw:
Just in case it's .json files that somehow raise credibility, if you aren't familiar they are literally just another way to store data. There's nothing magical about them. If the analysis had downloaded all the Times' Excel or .csv files, the situation would be identical.
The second key premise is that these findings are at all meaningful or indicative of something specific. Let's look at the example used in their primer section:
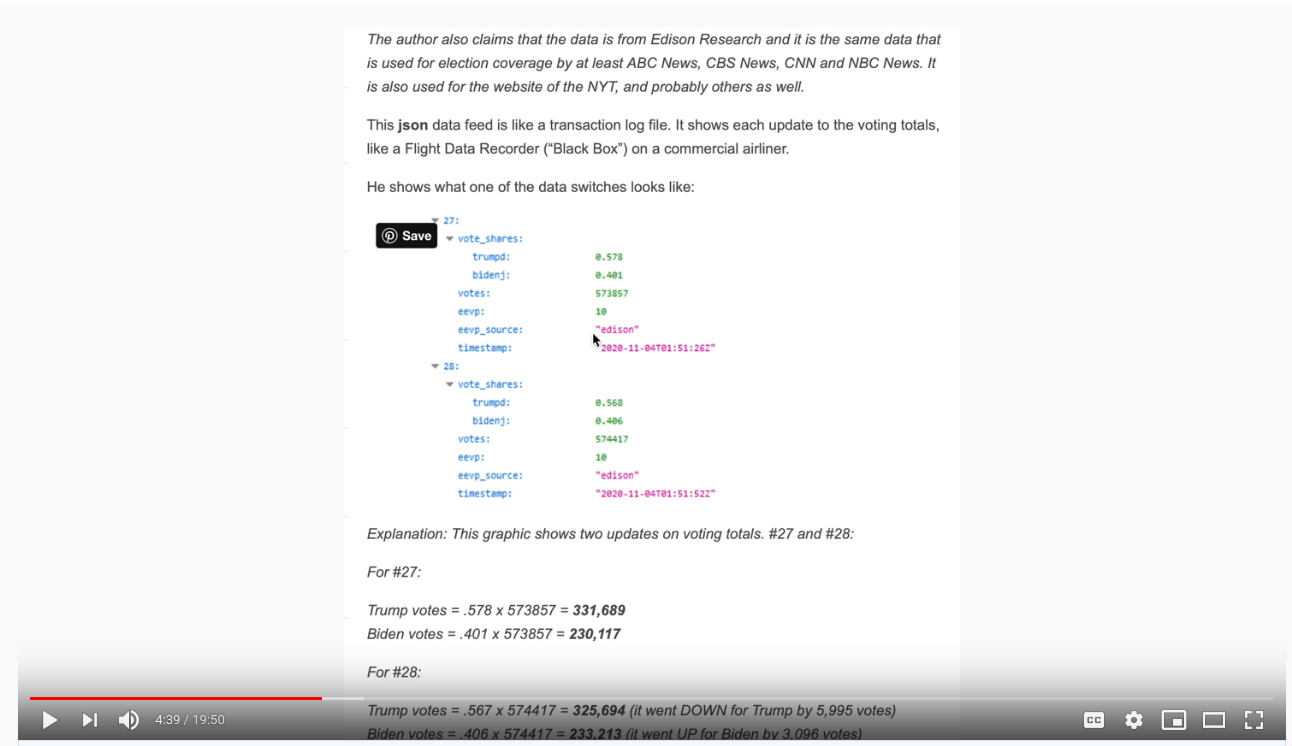
The data is as follows, with columns added for candidate votes (total votes * %):
| time | total votes | trump, % | trump, votes | biden, % | biden, votes |
|---|---|---|---|---|---|
| 2020-11-04 01:51:26 | 573857 | 0.578 | 331689 | 0.401 | 230117 |
| 2021-11-04 01:51:52 | 574417 | 0.568 | 326269 | 0.406 | 233213 |
| delta | 560 | -0.01 | -5420 | 0.005 | 3096 |
Assuming the first premise (the perfect truth of files used for news article visualizations), this does look odd. In ~30 seconds, the total votes went up, but somehow one of the candidates lost ~10x that many, and the other gained ~5x that many, with the net exchange being way off from the change in total votes.
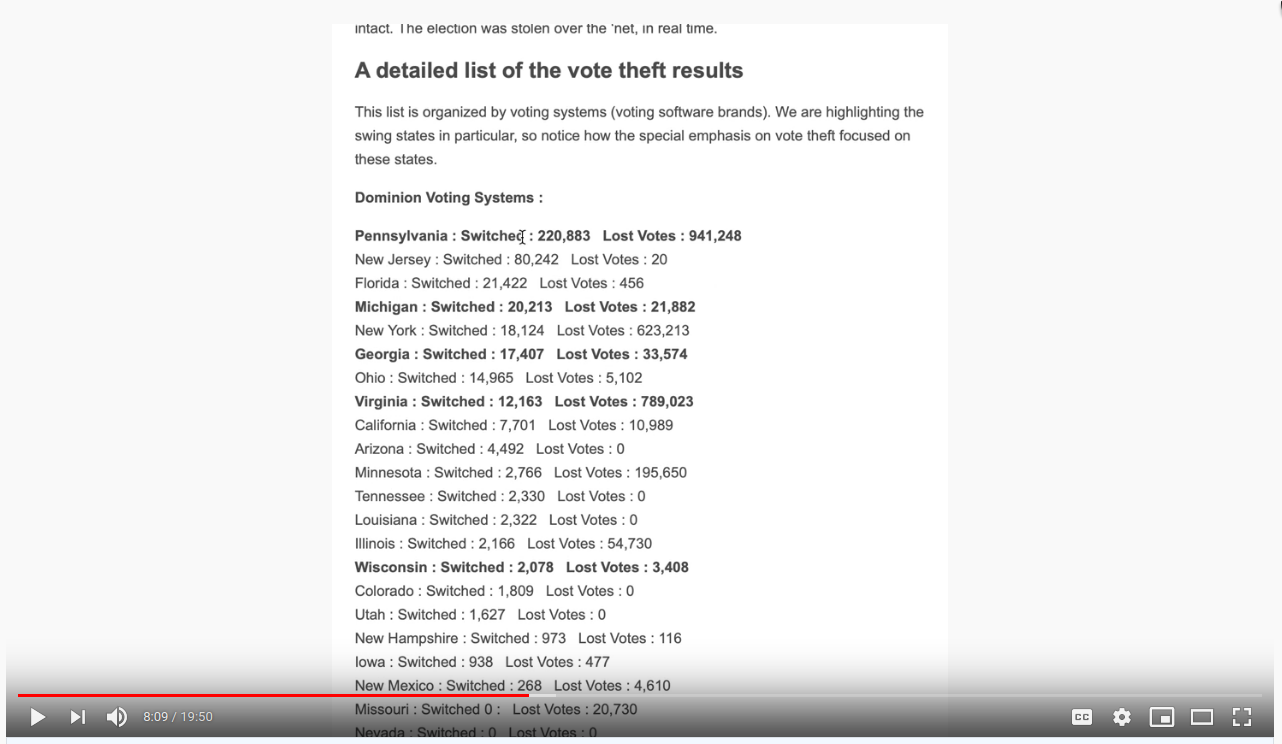
To apply this to all the data, someone wrote code which reads through all these snapshots and looks for these instances, tallies them all up, and spits out summary values per state, leading to these kinds of magnitudes across various states:
Is it true? At least the presenter repeatedly welcomed folks to try for themselves, so I did.
Before we move on, I want you to try something. You now know the angle this theory takes
and have seen some concrete numbers. In Pennsylvania, votes were "switched" and
"lost" to the tune of 220k and 940k, respectively. In your mind, or better yet on paper,
please draw a plot of y=votes and x=time might look like for a state with 6.86 million
total votes (3% switched, 13% lost during election night).
digging in
I'd already been playing with voting data pulled from the Times, so it was a relatively
simple matter to get all the timestamped files vs. the state and county results. I'm
leaving some code out for brevity (like purging non-states from the dict of abbreviations
used as states below), but this will get you close.
import data.us_state_abbrev as states
import json
import pandas as pd
import plotnine
import requests

from plotnine import *

### get all NY times data files
base_url = 'https://static01.nyt.com/elections-assets/2020/data/api/2020-11-03/race-page'
for state in states.us_state_abbrev.keys():
    state_code = state.replace(' ', '-')
    with open('./data/pres_ts_2020_nyt/{}.json'.format(state), 'wb') as f:
	f.write(requests.get('{}/{}/president.json'.format(base_url, state_code.lower())).content)
Next, we run through all the files and grab metadata and each snapshot, along with total votes and candidate percentages at that time:
def proc_results(state):
    with open('./data/pres_ts_2020_nyt/{}.json'.format(state), 'r') as f:
	dat = json.loads(f.read())

    results = [{
	'state': r['state_name'],
	'time': t['timestamp'],
	'votes_tot': t['votes'],
	'cand': c,
	'perc': v}
	for r in dat['data']['races'] for t in r['timeseries'] for c, v in t['vote_shares'].items()]

    return results

results = [proc_results(state) for state in states.us_state_abbrev.keys()]
results = [pd.DataFrame(r) for r in results]
df = pd.concat(results)
Lastly, we do some post-processing and add calculated columns.
df['time'] = pd.to_datetime(df['time'])
df['votes'] = (df['votes_tot'] * df['perc']).astype(int)
df['i'] = df.groupby(['state', 'cand'])['votes'].transform(lambda x: range(len(x)))
df = df.sort_values(['state', 'cand', 'time'])
df['votes_perc'] = df.groupby(['state', 'cand'], as_index=False)['votes'].transform(lambda x: x/x.max())
print(df)
###
       state                      time  votes_tot    cand   perc   votes  votes_perc   i
3    Alabama 2020-11-04 01:23:07+00:00       1053  bidenj  0.585     616    0.000731   0
5    Alabama 2020-11-04 01:28:39+00:00       2190  bidenj  0.602    1318    0.001563   1
7    Alabama 2020-11-04 01:29:35+00:00       3709  bidenj  0.489    1813    0.002150   2
9    Alabama 2020-11-04 01:32:46+00:00       4280  bidenj  0.474    2028    0.002405   3
11   Alabama 2020-11-04 01:40:51+00:00       5249  bidenj  0.476    2498    0.002963   4
..       ...                       ...        ...     ...    ...     ...         ...  ..
92   Wyoming 2020-11-11 20:35:54+00:00     276630  trumpd  0.700  193641    0.999819  46
94   Wyoming 2020-11-11 20:36:41+00:00     276648  trumpd  0.700  193653    0.999881  47
96   Wyoming 2020-11-11 20:37:31+00:00     276679  trumpd  0.700  193675    0.999995  48
98   Wyoming 2020-11-11 20:37:50+00:00     276681  trumpd  0.700  193676    1.000000  49
100  Wyoming 2020-11-11 21:13:55+00:00     276765  trumpd  0.699  193458    0.998874  50
If you haven't used plotnine, I highly recommend it. It's the python equivalent to
ggplot2 in R, and I just don't think I'll ever be able to live without facet plots again.
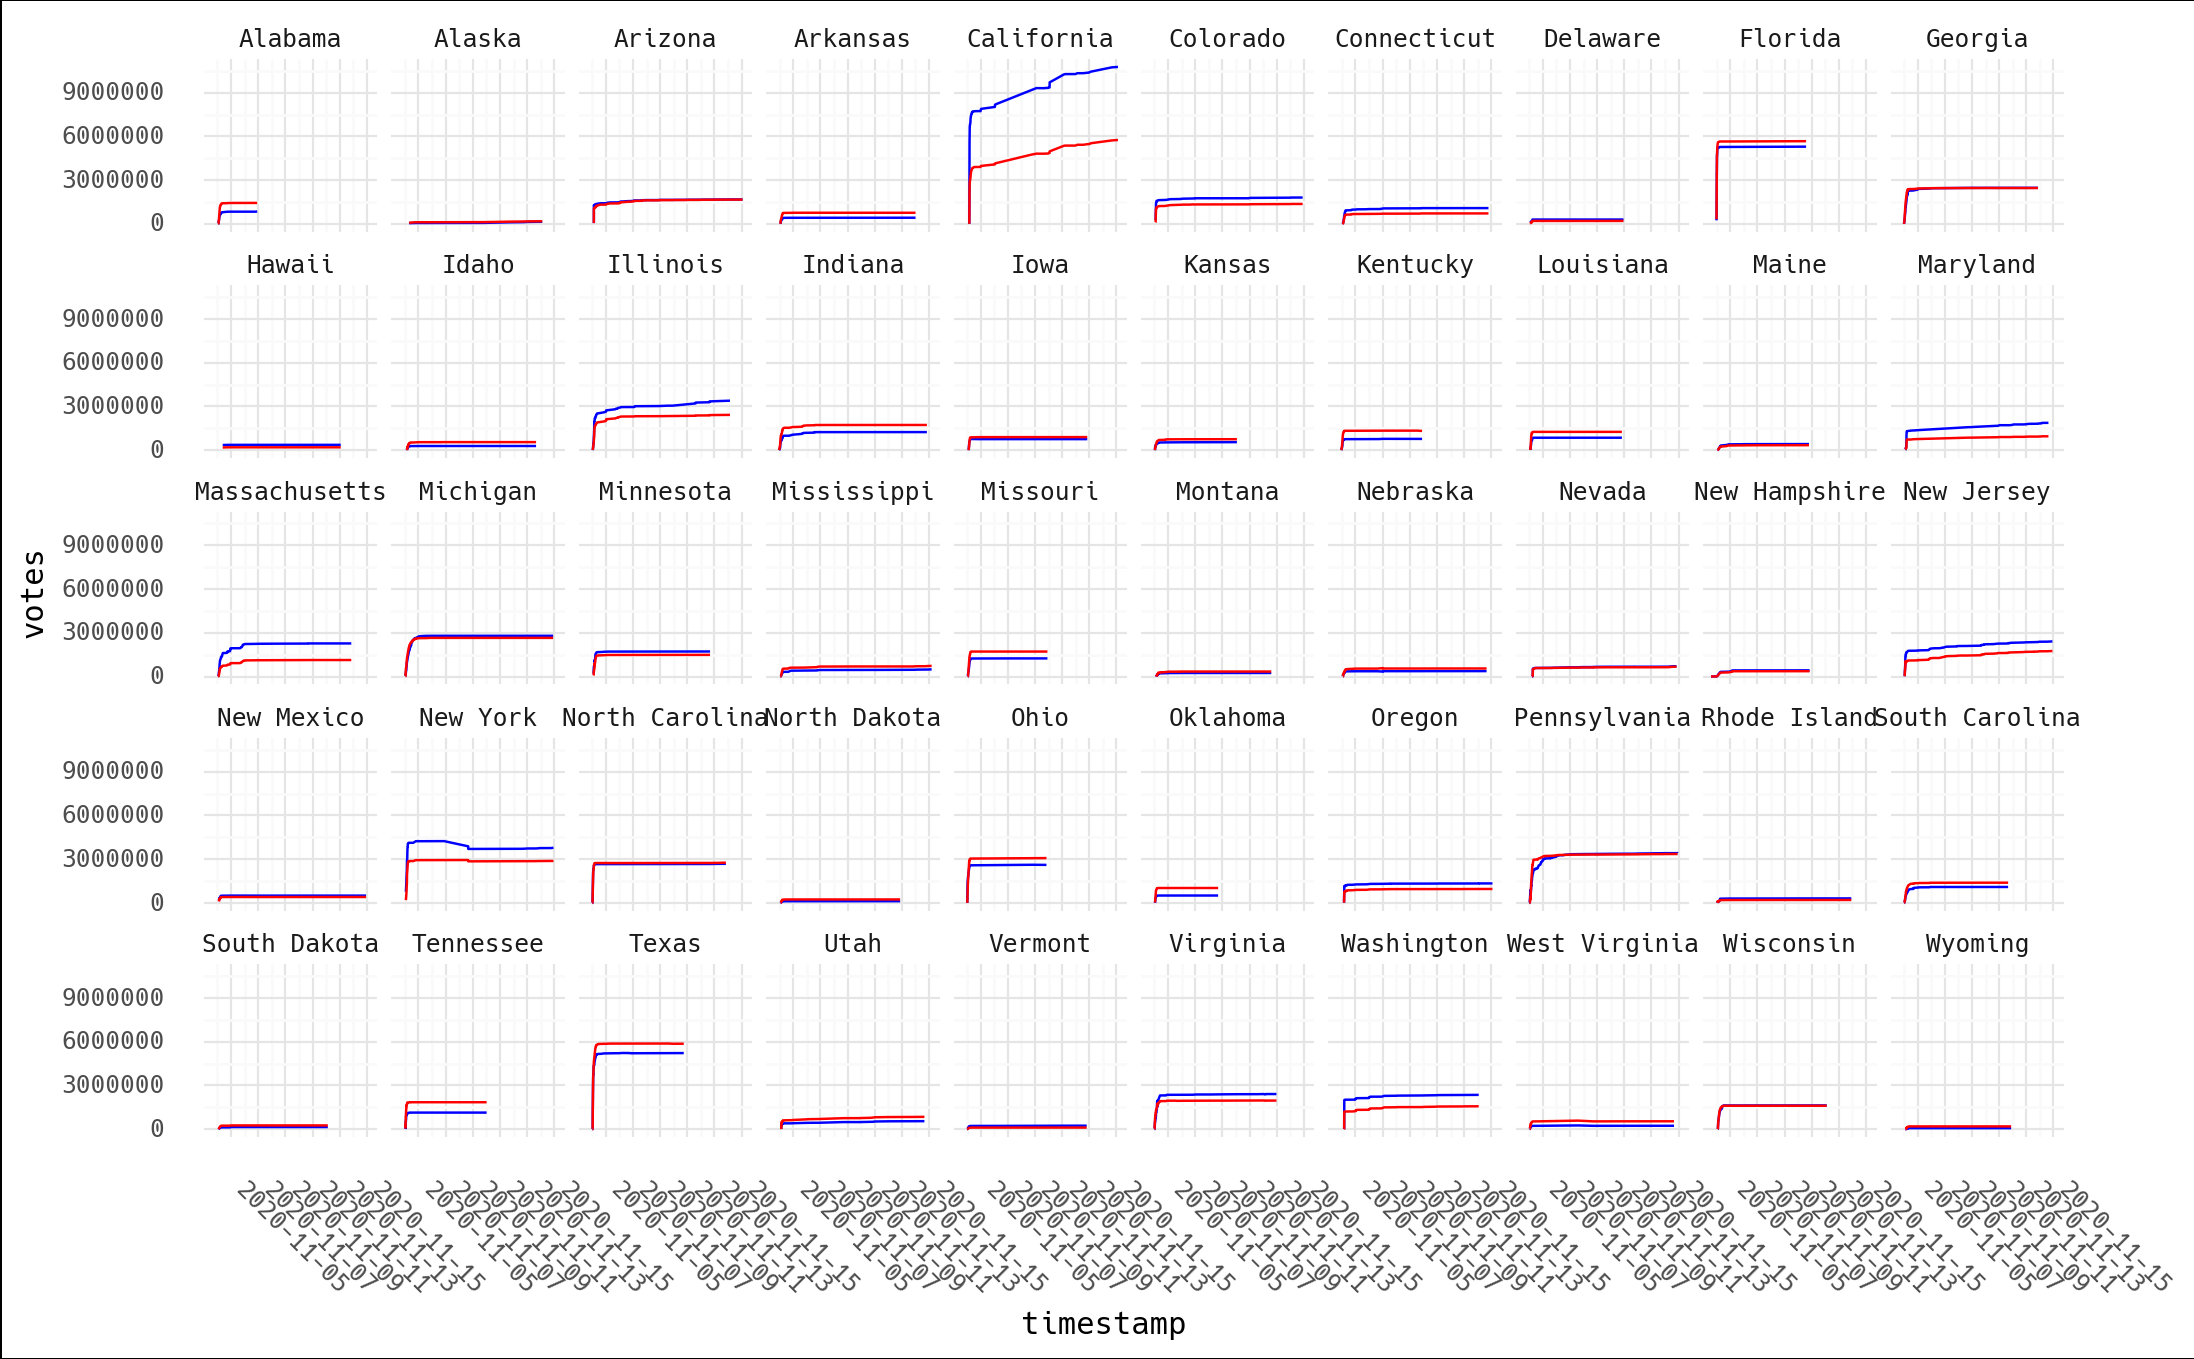
p = ggplot(df, aes(x='time', y='votes', color='cand', group='state+cand')) + geom_line() + facet_wrap('~state', ncol=10)
p = p + scale_color_manual(breaks=['bidenj', 'trumpd'], values=['blue', 'red'], guide=False)
p = p + scale_y_continuous(name='delta')
p = p + scale_x_datetime(name='timestamp')
p = p + theme_minimal() + theme(text=element_text(family='Hack'),
				plot_background=element_rect(fill='white'),
				axis_text_x=element_text(angle=315, hjust=0))
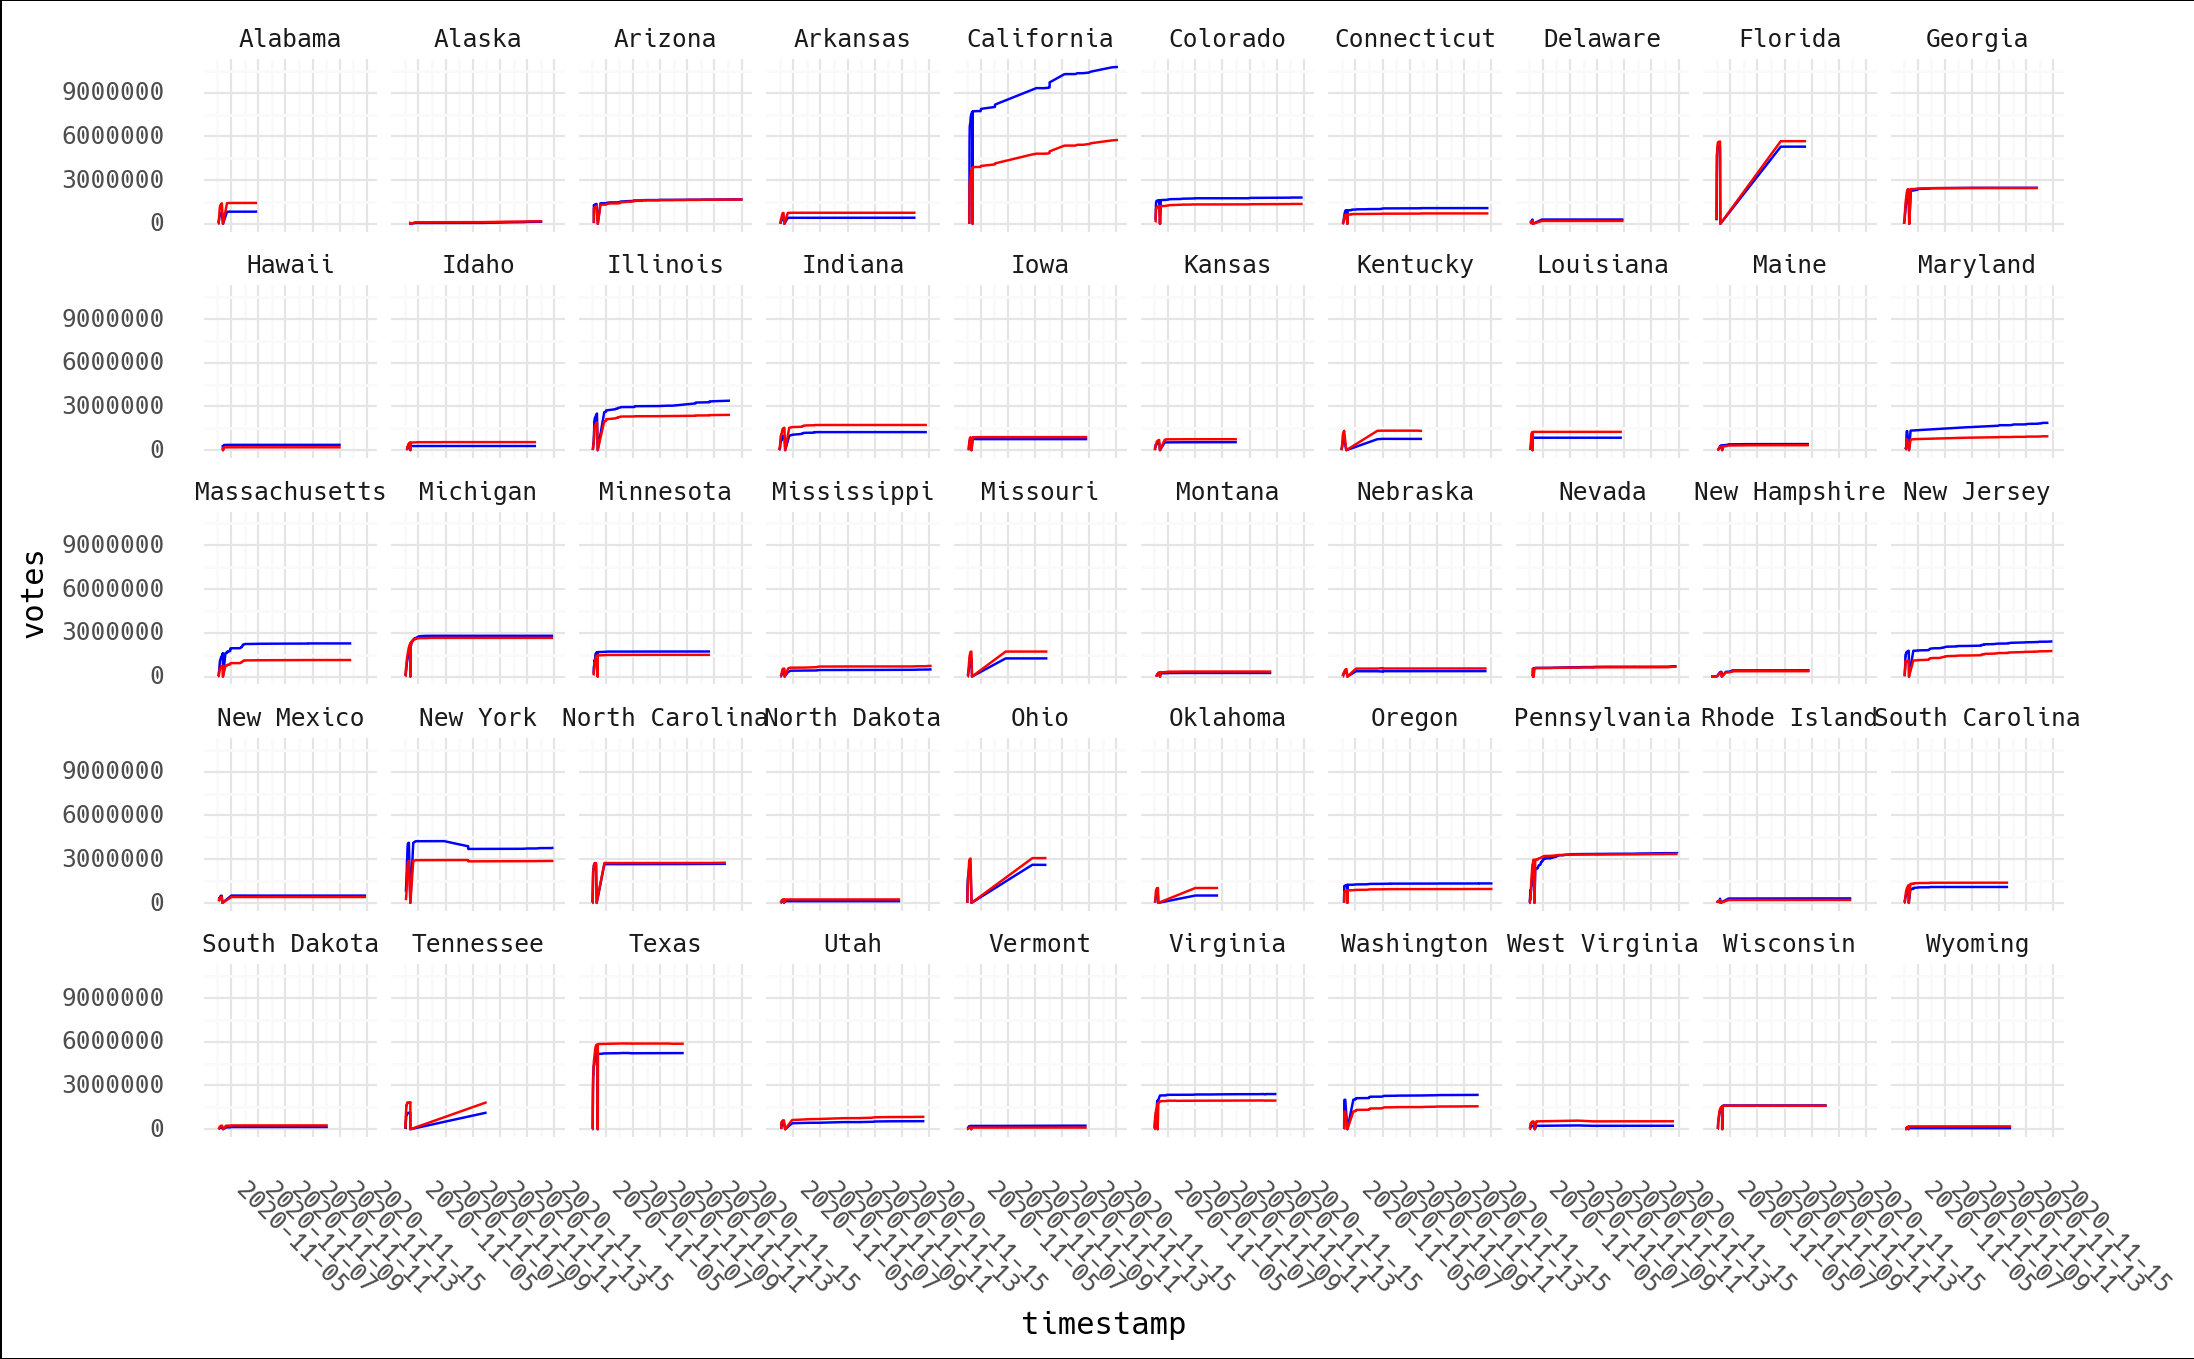
What do you see? Per our earlier exercise, when I did this last night, despite already thinking NYT json reliability was suspect, this certainly didn't look like I expected. The video is 18min of yelling the incontrovertable fact that this shows election theivery! I see… a bunch of dips followed by recovery and then all is well? Let's pick two and take a closer look:
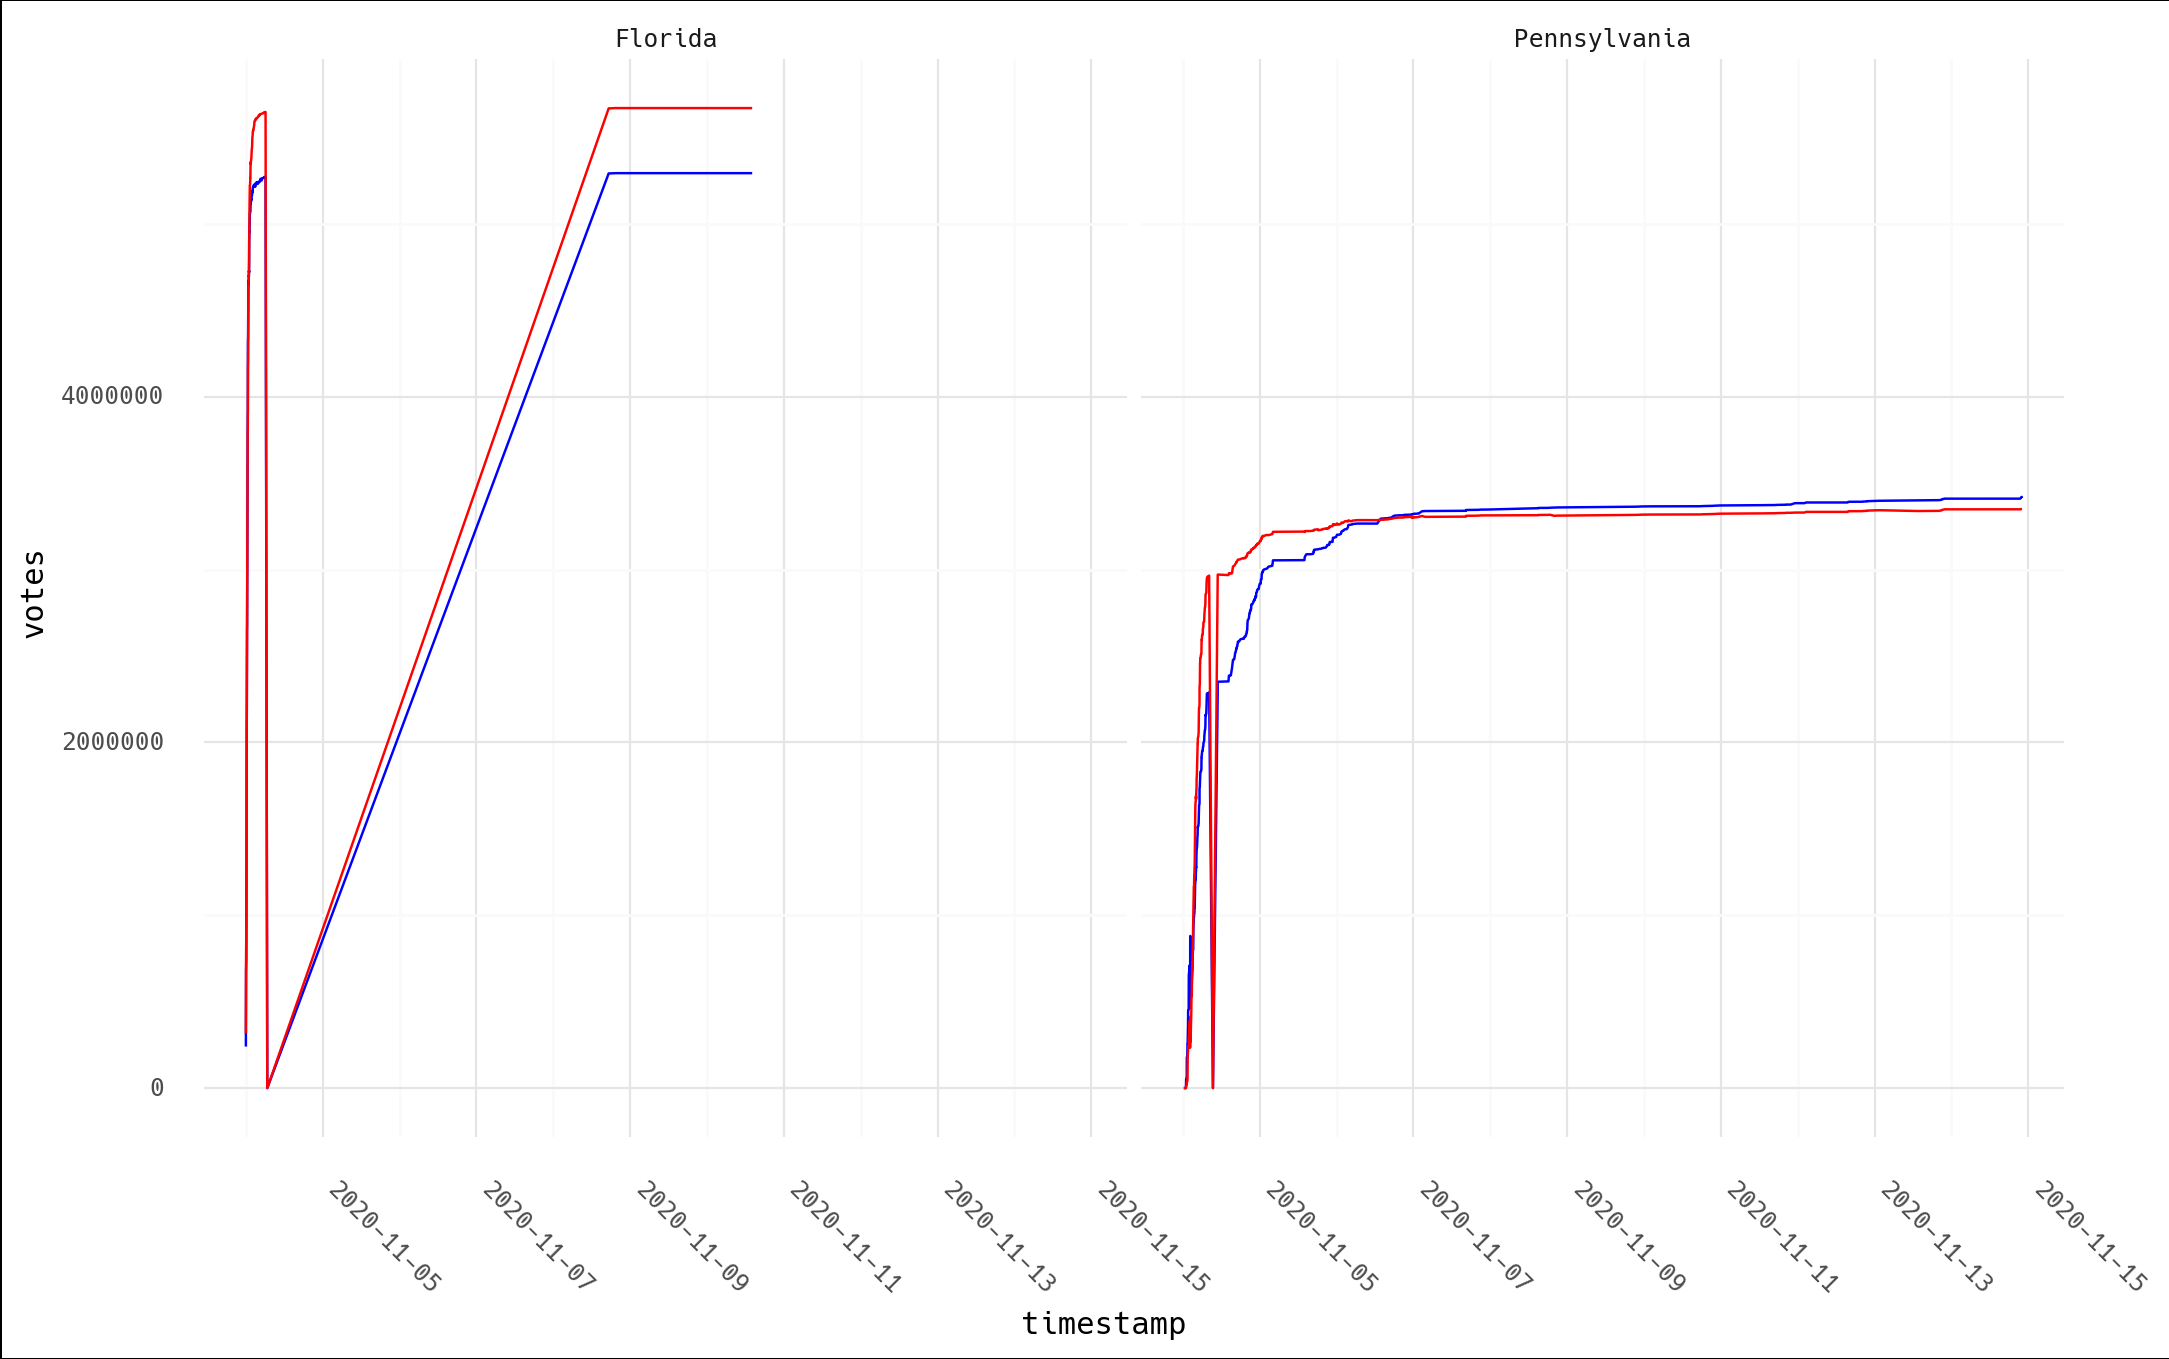
Hmmm. Let's look at the area around zero.
df_sub = df.loc[df['state'].isin(['Florida', 'Pennsylvania'])]
print(df_sub[df_sub['state']=='Pennsylvania'].head())
print(df_sub[df_sub['state']=='Florida'].head())
print(df_sub[df_sub['votes'] == 0])
print(df_sub.groupby('state', as_index=False).agg({'time': 'min', 'votes': 'first'}))
###
# first 5 rows for FL
      state                      time  votes_tot    cand   perc   votes  i  votes_perc
3   Florida 2020-11-04 00:02:01+00:00     560771  bidenj  0.428  240009  1    0.045334
5   Florida 2020-11-04 00:02:42+00:00     844914  bidenj  0.434  366692  2    0.069263
7   Florida 2020-11-04 00:03:26+00:00    1004171  bidenj  0.435  436814  3    0.082507
9   Florida 2020-11-04 00:05:44+00:00    1457441  bidenj  0.467  680624  4    0.128559
11  Florida 2020-11-04 00:07:05+00:00    1515932  bidenj  0.461  698844  5    0.132001

# first 5 rows for PA
	   state                      time  votes_tot    cand   perc  votes  i  votes_perc
2   Pennsylvania 2020-11-04 00:19:27+00:00         77  bidenj  0.571     43  1    0.000013
5   Pennsylvania 2020-11-04 00:30:20+00:00          0  bidenj  0.000      0  2    0.000000
6   Pennsylvania 2020-11-04 00:42:45+00:00         11  bidenj  0.636      6  3    0.000002
9   Pennsylvania 2020-11-04 00:59:15+00:00          0  bidenj  0.000      0  4    0.000000
10  Pennsylvania 2020-11-04 01:03:44+00:00      64535  bidenj  0.799  51563  5    0.015074

# entries with votes==0
	  state                      time  votes_tot    cand  perc  votes  i  votes_perc
1       Florida 2020-11-04 06:43:00+00:00          0  bidenj   0.0      0  0         0.0
0       Florida 2020-11-04 06:43:00+00:00          0  trumpd   0.0      0  0         0.0
5  Pennsylvania 2020-11-04 00:30:20+00:00          0  bidenj   0.0      0  2         0.0
9  Pennsylvania 2020-11-04 00:59:15+00:00          0  bidenj   0.0      0  4         0.0
1  Pennsylvania 2020-11-04 09:25:23+00:00          0  bidenj   0.0      0  0         0.0
4  Pennsylvania 2020-11-04 00:30:20+00:00          0  trumpd   0.0      0  2         0.0
8  Pennsylvania 2020-11-04 00:59:15+00:00          0  trumpd   0.0      0  4         0.0
0  Pennsylvania 2020-11-04 09:25:23+00:00          0  trumpd   0.0      0  0         0.0

# earliest time in each state
	  state                      time
0       Florida 2020-11-04 00:02:01+00:00
1  Pennsylvania 2020-11-04 00:19:27+00:00
Honestly, who knows, but at this point we can see a few things:
- the data is in order of increasing time
- the first entries have non-zero votes
- later, both states have votes=0 entries
- even so, each plot recovers, and near the same pre-dip total and in the same relative ranking (Biden or Trump ahead pre/post-dip)
- the
icolumn matches the order of the data; I added it before sorting by time. Note that in both cases thei=0timestamp is not the earliest in the data. In the PA case, the first entry in the series (i=0) has a timestamp 9 hours later than the earliest timestamp
How those zeros got entered with later times, I have no idea, but if you do any data
analysis or write code, this is not that surprising. Again, this is data
used for a news site graphic. Maybe they started collecting data from Edison's API (and
again, this is not to say that Edison is ground truth vote source), and someone
noticed all their plots were missing a starting point where votes=0 so they manually
entered it. Or the endpoint went down and logged a zero entry because it failed to collect
any data? We don't even know if total votes and candidate percents were calculated with
respect to the same source data.
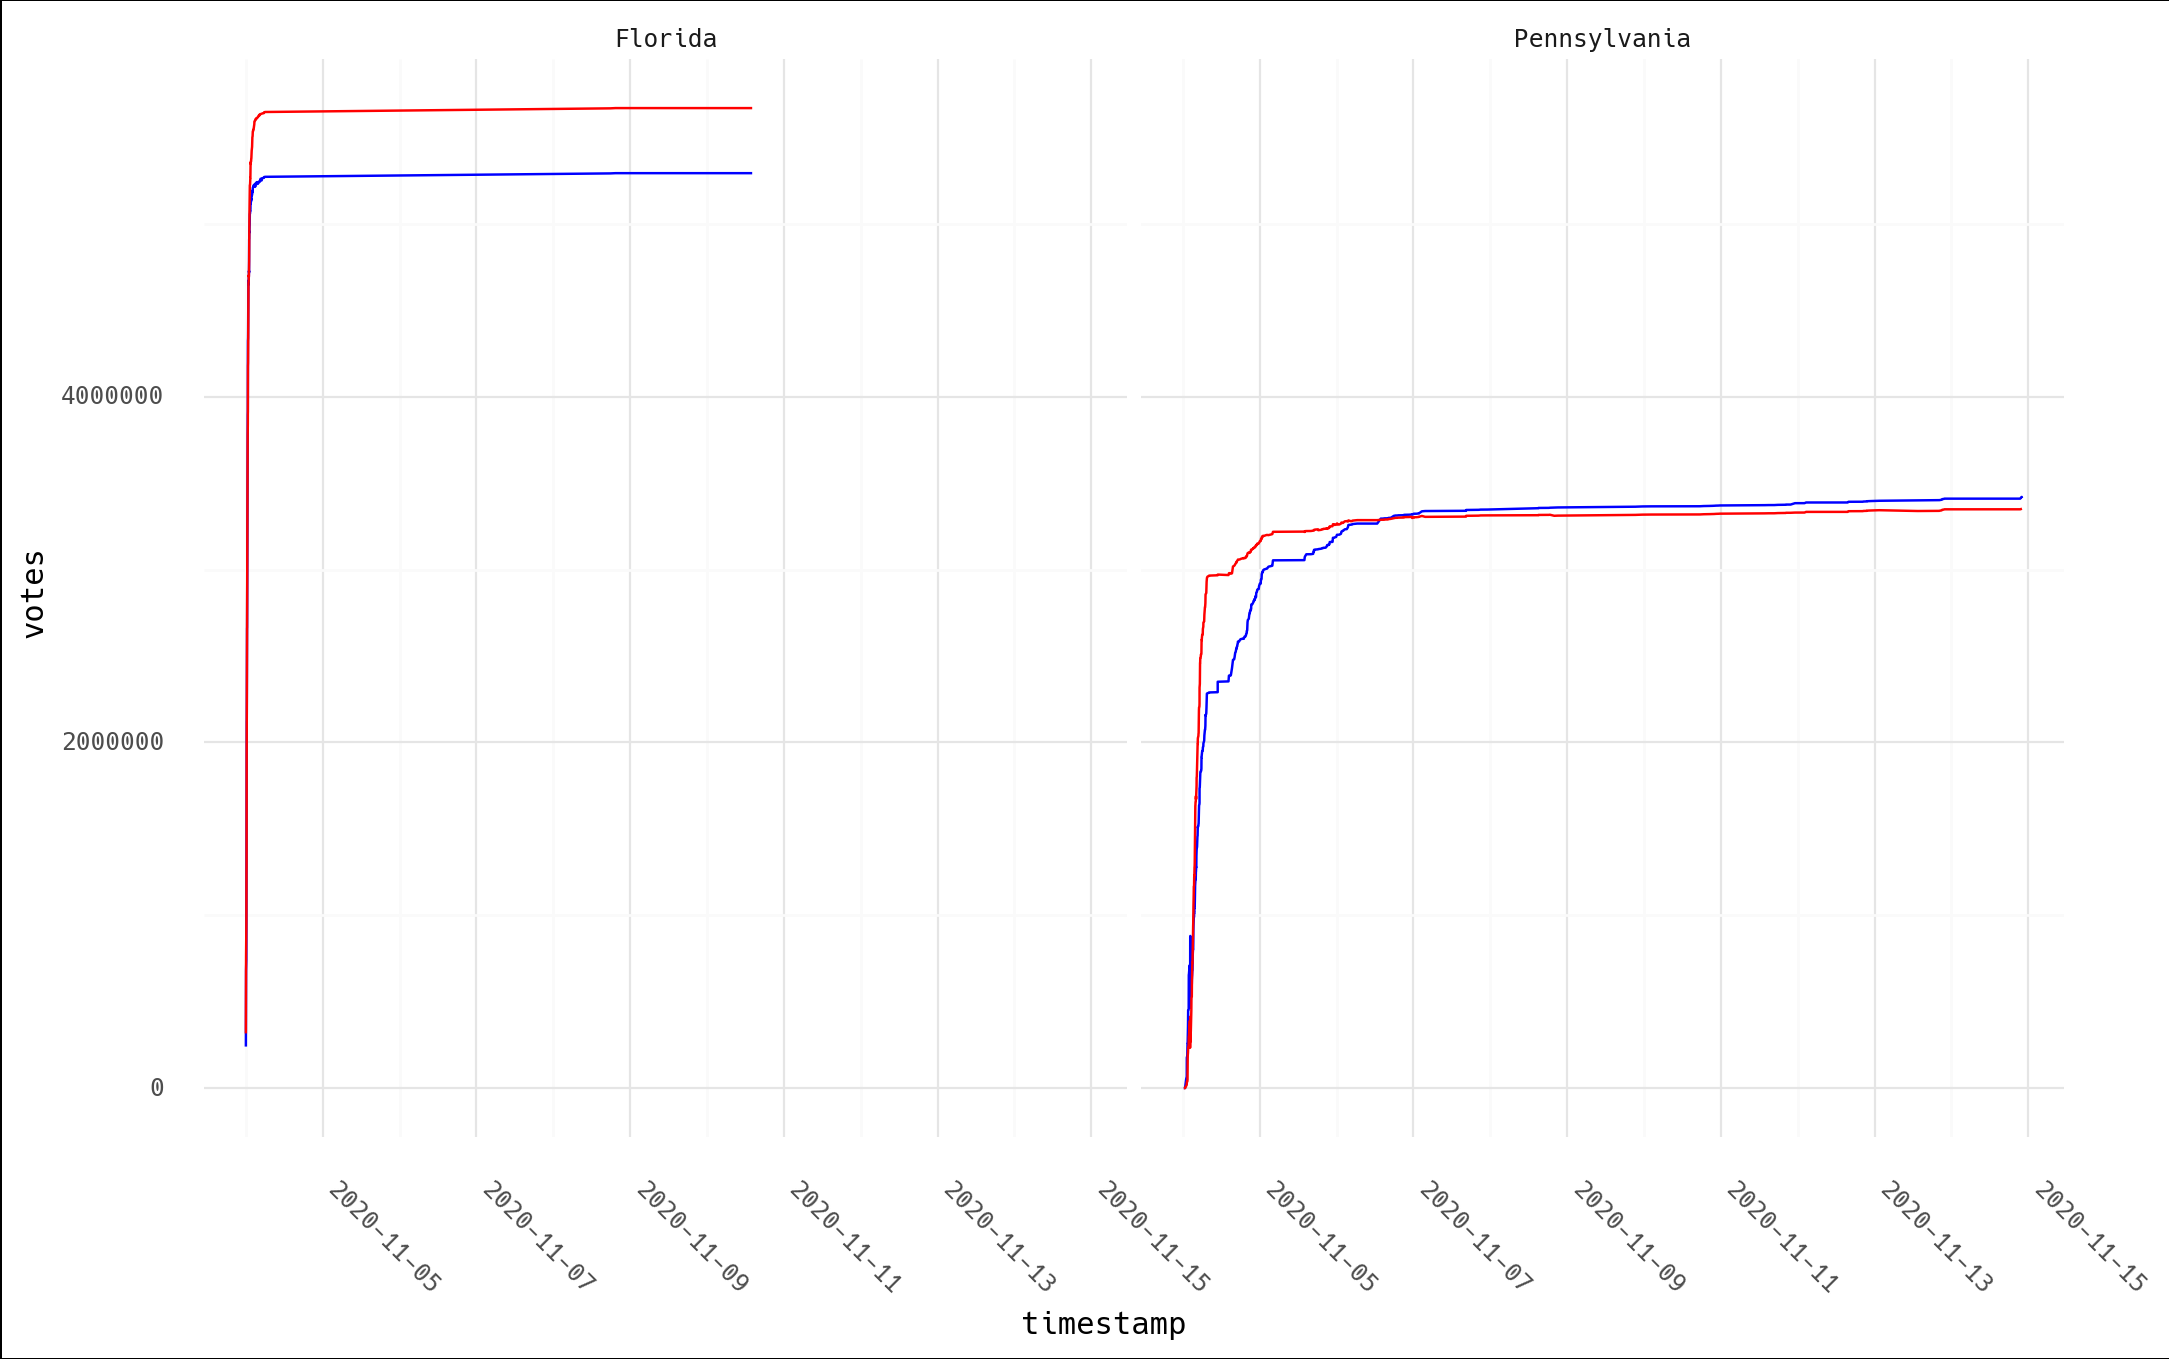
What if we just treat votes=0 as a fluke and remove those rows (2 for FL, 6 for
PA)? I don't suppose you drew a plot of what 220k switched votes and 940k lost votes looks
like, did you? I'm guessing it isn't this:
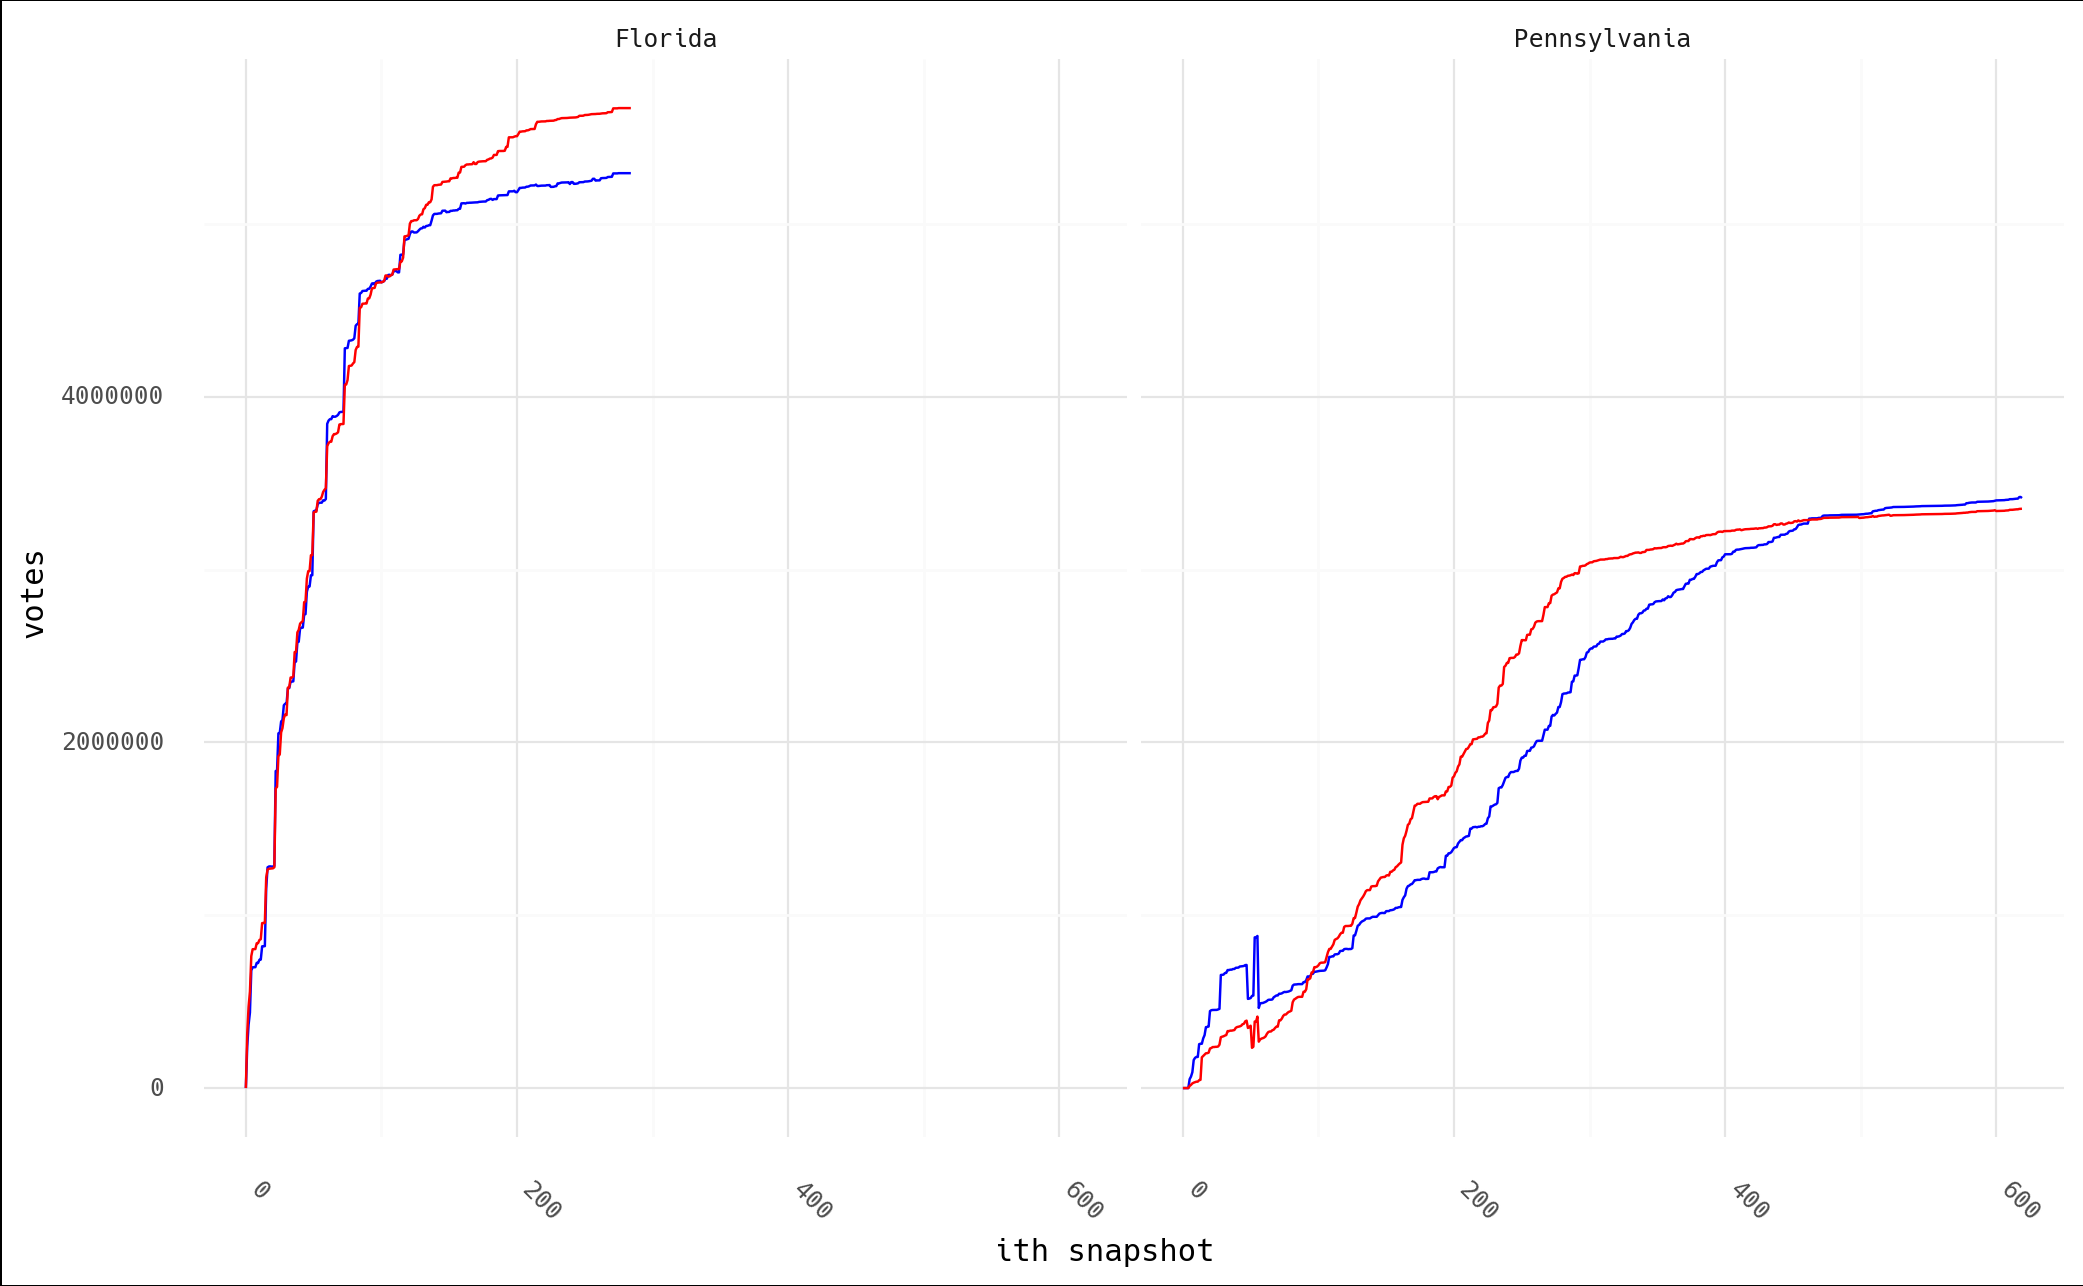
And if we leave in the zeros and just plot the data in the order of the snapshots, here's what we see. Again, I doubt this matches anyone's intuitive interpretation of "Trump lost 940k votes during the PA election."
the code
Now, what's the code behind this, anyway? Well, again, while I admit I think this theory
is absolutely preposterous, kudos for sharing the source the code. If you know python, I'm
sorry nightmares are inevitable for you tonight:
def findfraud(NAME):
    with open(NAME + '.json', encoding="utf8") as f:
	x = json.load(f)
    TotalVotesLostTrump = 0
    TotalVotesLostBiden = 0
    TrumpToThird = 0
    TrumpToBiden = 0
    BidenToTrump = 0
    ThirdToTrump = 0
    ThirdToBiden = 0
    BidenToThird = 0
    TotalVotesLostThird = 0
    series = x["data"]["races"][0]["timeseries"]
    for i in range(len(series)):
	    thirdPartyNow = series[i]["votes"] * (1 - series[i]["vote_shares"]["bidenj"] - series[i]["vote_shares"]["trumpd"])
	    thirdPartyThen = series[i-1]["votes"] * (1 - series[i-1]["vote_shares"]["bidenj"] - series[i-1]["vote_shares"]["trumpd"])
	    TrumpNow = series[i]["votes"] * series[i]["vote_shares"]["trumpd"]
	    TrumpThen = series[i-1]["votes"] * series[i-1]["vote_shares"]["trumpd"]
	    BidenNow = series[i]["votes"] * series[i]["vote_shares"]["bidenj"]
	    BidenThen = series[i-1]["votes"] * series[i-1]["vote_shares"]["bidenj"]
	    if i != 0 and TrumpNow < TrumpThen and (TrumpThen - TrumpNow) > (0.00049999 * series[i]["votes"]) + 50:
		if BidenNow > BidenThen or thirdPartyNow > thirdPartyThen:
		    if TrumpNow - TrumpThen <= BidenNow - BidenThen or TrumpNow - TrumpThen <= thirdPartyNow - thirdPartyThen:
			print ("(TRUMP")
			print ("Index : " + str(i) + " Past Index : " + str(i-1))
			print (TrumpNow - TrumpThen)
			TrumpLostNow = TrumpThen - TrumpNow
			TrumpLostTotal = TrumpThen - TrumpNow
			if BidenNow > BidenThen and TrumpNow - TrumpThen <= BidenNow - BidenThen:
			    if BidenNow - BidenThen > TrumpLostTotal:
				TrumpToBiden += TrumpLostTotal
				TrumpLostTotal = 0
			    else:
				TrumpToBiden += BidenNow - BidenThen
				TrumpLostTotal -= BidenNow - BidenThen
			if thirdPartyNow > thirdPartyThen and TrumpNow - TrumpThen <= thirdPartyNow - thirdPartyThen:
			    if thirdPartyNow - thirdPartyThen > TrumpLostTotal:
				TrumpToThird += TrumpLostTotal
				TrumpLostTotal = 0
			    else:
				TrumpToThird += thirdPartyNow - thirdPartyThen
				TrumpLostTotal -= thirdPartyNow - thirdPartyThen
			if TrumpLostNow < 0:
			    TrumpLostNow = 0
			TotalVotesLostTrump += TrumpLostNow - TrumpLostTotal
			print ("TRUMP)")
That's just one of the three main logic branches. There's two others for Biden and third party votes just like it. I admit I don't follow all of this. Reading someone else's code, particularly heavily nested and inefficient like this is tedious. The gist is comparing timeseries indices for changes in vote counts, and trying to infer who they went to by comparing the shifts in other parties as well, hence printing out this summary at the end:
print (str(str(TotalVotesLostTrump)  + " TRUMP LOST"))
print (str(TrumpToBiden) + " Trump to Biden")
print (str(TrumpToThird) + " Trump to Third")
print (str(str(TotalVotesLostBiden)  + " BIDEN LOST"))
print (str(BidenToTrump) + " Biden to Trump")
print (str(BidenToThird) + " Biden to Third")
print (str(str(TotalVotesLostThird)  + " 3RD PARTY LOST"))
print (str(ThirdToBiden) + " Third to Biden")
print (str(ThirdToTrump) + " Third to Trump")
if BidenToTrump > TrumpToBiden:
    print (str(BidenToTrump - TrumpToBiden) + " TRUMP")
elif TrumpToBiden > BidenToTrump:
    print (str(TrumpToBiden - BidenToTrump) + " BIDEN")
There's another function, lostvotes() that looks to do something similar, tabulating all
the lost votes per candidate. So, what do they show? I modified them to point to my data
directory and ran it on Pennsylvania, which is a fun one due it's massive numbers.
findfraud('Pennsylvania')
lostvotes('Pennsylvania')

# findfrand()
88769.8330000007 TRUMP LOST
49718.495999999344 Trump to Biden
39051.33700000135 Trump to Third
27413.24899999972 BIDEN LOST
7159.232000000076 Biden to Trump
20254.016999999643 Biden to Third
223140.98500000124 3RD PARTY LOST
216223.19600000113 Third to Biden
6917.789000000117 Third to Trump
42559.26399999927 BIDEN

# lostvotes()
Index : 2 Past Index : 1
-77
Index : 4 Past Index : 3
-11
Index : 48 Past Index : 47
-239804
Index : 56 Past Index : 55
-586189
-187542.07999999996 TRUMP
-613071.5320000001 BIDEN
-25467.387999999948 THIRD
-826081
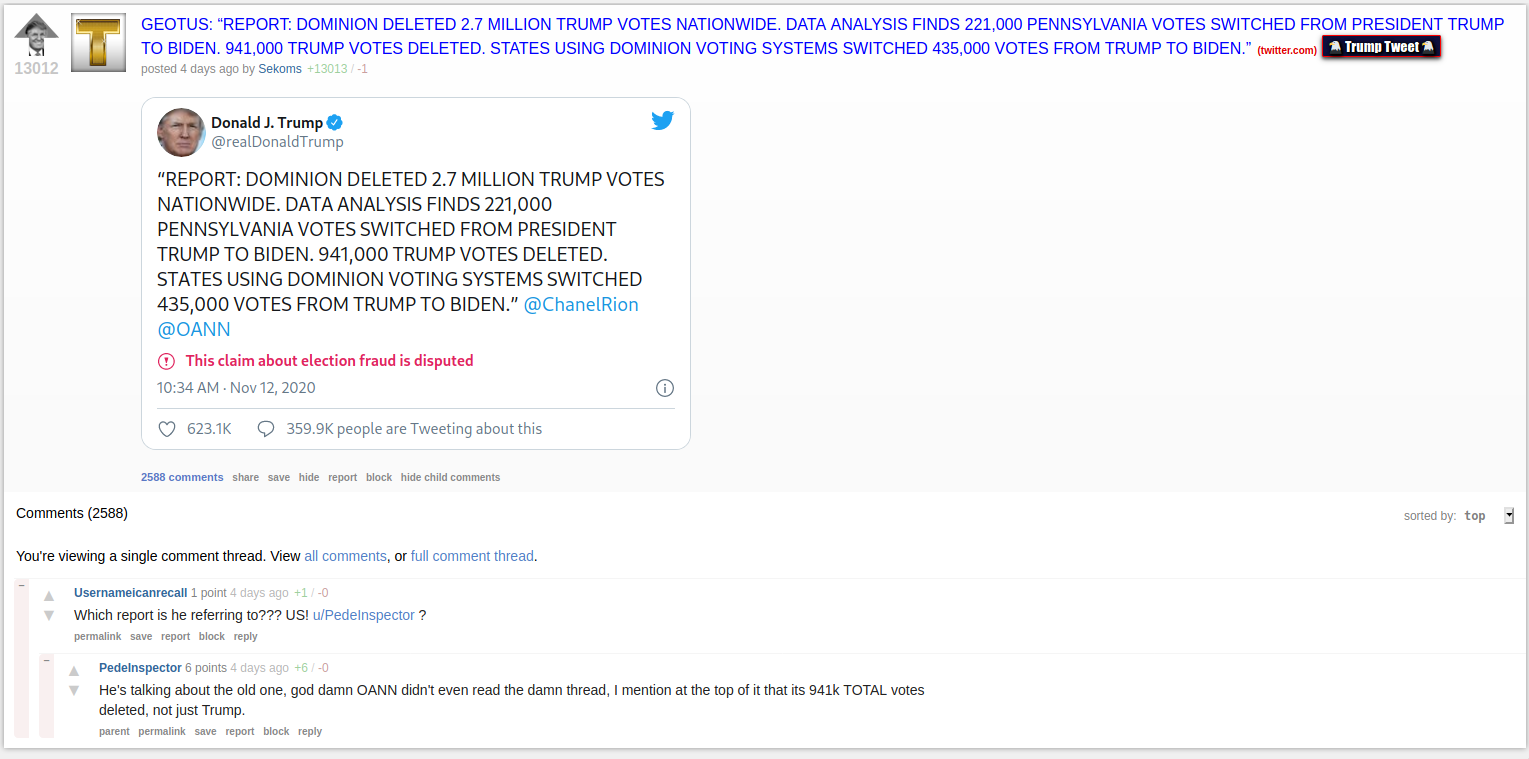
Returning to the video for a moment, we have the following quote at 7:55:
We know that this election was stolen over the net in real time. This list is organized by
voting systems. And now they're going to highlight some of the swing states. In
Pennsylvania they recorded 220,883 votes that switched to Joe Biden. Trump lost 941,248
votes.
findfraud() shows votes going all over the place. I suppose one would rationalize this
away by saying that fraud is somewhat of a shell game, and having votes go from Trump to Biden and
Biden to Trump would help hide the activities. Assuming lostvotes() is the summary
situation, though, Biden lost ~3x the votes that Trump did. Again, I applaud the
invitation to run the code, but with the rave reviews for this incredible, rock solid
finding in the YouTube comments, I'm guessing no one actually did.
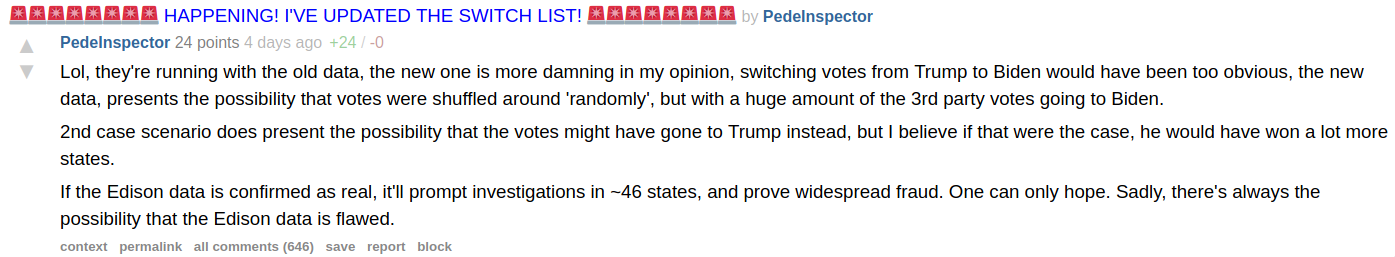
Even the original author of this work (PedeInspector) disagrees with this interpretation, despite it being already passed along publicly by Trump.
My assessment at this point is that this code just blindly runs some calculations, without actually verifying what it's finding or whether that seems sane. For example… seeing the indices with the biggest losses at 48 and 56 in the data, let's go look at them.
print(df[df['state']=='Pennsylvania'].iloc[45:50])
	    state                      time  votes_tot    cand   perc   votes   i  votes_perc
92   Pennsylvania 2020-11-04 02:11:01+00:00    1106477  bidenj  0.643  711464  46    0.207993
94   Pennsylvania 2020-11-04 02:13:11+00:00    1111586  bidenj  0.641  712526  47    0.208303
96   Pennsylvania 2020-11-04 02:14:32+00:00     871782  bidenj  0.592  516094  48    0.150877
98   Pennsylvania 2020-11-04 02:14:56+00:00     877724  bidenj  0.590  517857  49    0.151393
100  Pennsylvania 2020-11-04 02:16:43+00:00     888907  bidenj  0.586  520899  50    0.152282

print(df[df['state']=='Pennsylvania'].iloc[52:57])
	    state                      time  votes_tot    cand   perc   votes   i  votes_perc
106  Pennsylvania 2020-11-04 02:18:59+00:00    1288475  bidenj  0.677  872297  53    0.255012
108  Pennsylvania 2020-11-04 02:19:33+00:00    1288604  bidenj  0.677  872384  54    0.255037
110  Pennsylvania 2020-11-04 02:21:59+00:00    1325632  bidenj  0.664  880219  55    0.257327
112  Pennsylvania 2020-11-04 02:22:45+00:00     739443  bidenj  0.627  463630  56    0.135540
114  Pennsylvania 2020-11-04 02:23:32+00:00     779178  bidenj  0.629  490102  57    0.143279
Taking a look at this anther way, we can just calculate the diff() on our votes column,
and look for the biggest changes:
df = df.sort_values(['state', 'cand', 'i'])
df['delta'] = df.groupby(['state', 'cand'])['votes'].transform(lambda x: x.diff())
print(df[(df['state']=='Pennsylvania') & (df['delta'] < -10000)])
print(df[(df['state']=='Pennsylvania') & (df['delta'] < -10000)]['delta'].sum())
###
# biggest swings in votes
	    state                      time  votes_tot    cand   perc    votes    i  votes_perc     delta
96   Pennsylvania 2020-11-04 02:14:32+00:00     871782  bidenj  0.592   516094   48    0.150877 -196432.0
112  Pennsylvania 2020-11-04 02:22:45+00:00     739443  bidenj  0.627   463630   56    0.135540 -416589.0
97   Pennsylvania 2020-11-04 02:14:32+00:00     871782  trumpd  0.399   347841   48    0.103760  -42325.0
103  Pennsylvania 2020-11-04 02:17:03+00:00     774021  trumpd  0.301   232980   51    0.069497 -127916.0
113  Pennsylvania 2020-11-04 02:22:45+00:00     739443  trumpd  0.363   268417   56    0.080068 -145180.0
376  Pennsylvania 2020-11-04 04:08:51+00:00    2984522  trumpd  0.560  1671332  188    0.498553  -17876.0

# total "lost votes"
-946318.0
Does this fit the narrative at all? Biden is the source of 600k of those 900k lost votes… but the
quote above presents Trump as having lost almost 1M votes in PA. How about the other swing
states? lostvotes() returned all zeros for Arizona, Georgia, Michigan, and Wisconsin. How about findfraud()?
findfraud('Arizona')
findfraud('Georgia')
findfraud('Michigan')
findfraud('Wisconsin')

# Arizona
4492.284999999916 TRUMP LOST
532.839999999851 Trump to Biden
3959.445000000065 Trump to Third
11413.710000000196 BIDEN LOST
4917.905999999959 Biden to Trump
6495.804000000237 Biden to Third
36773.55299999989 3RD PARTY LOST
35530.15799999998 Third to Biden
1243.3949999999095 Third to Trump
4385.066000000108 TRUMP

# Georgia
20215.65600000025 TRUMP LOST
6956.512000000046 Trump to Biden
13259.144000000204 Trump to Third
5456.885000000213 BIDEN LOST
3530.7619999998715 Biden to Trump
1926.1230000003416 Biden to Third
98070.76399999915 3RD PARTY LOST
81906.734999999 Third to Biden
16164.02900000017 Third to Trump
3425.7500000001746 BIDEN

# Michigan
16807.160000000382 TRUMP LOST
9395.204000000726 Trump to Biden
7411.955999999656 Trump to Third
24250.137000000395 BIDEN LOST
11981.314000000828 Biden to Trump
12268.822999999567 Biden to Third
149435.23900000064 3RD PARTY LOST
124803.46400000044 Third to Biden
24631.775000000212 Third to Trump
2586.1100000001024 TRUMP

# Wisconsin
0 Trump to Biden
390.70799999998417 Trump to Third
13927.016999999993 BIDEN LOST
5800.282999999821 Biden to Trump
8126.734000000171 Biden to Third
59287.08899999898 3RD PARTY LOST
50930.62899999939 Third to Biden
8356.459999999588 Third to Trump
5800.282999999821 TRUMP
Are you seeing a pattern here? No matter how we slice and dice this thing, there's just no substance. In three of four cases, Biden lost more votes to Trump than the other way around (and I think the print out at the bottom is the net result, so Trump came out net beneffiting from this). Ironically, the one where Biden supposedly had an advantage was Georgia which was the closest of the four.
Here's all 50 states again, with the votes=0 entries removed:
Is it everything you imagined?
a final angle
There's a more subtle issue going on here.
- inputs are % share and total votes
- for each candidate, we take as true both inputs to caluclate candidate votes
- this implies that we have discovered the true votes behind the scenes
- with each new update, the deltas are being calculated based on reported votes and percentages… while the whole premise of this calculation is that we've discovered a more accurate truth
In essence, the ability to infer that the data is manipulated/false, and yet continue to rely on it for subsequent calculations is contradictory. Let's return to the concrete example used from Michgan:
| time | total votes | trump, % | trump, votes | biden, % | biden, votes |
|---|---|---|---|---|---|
| 2020-11-04 01:51:26 | 573857 | 0.578 | 331689 | 0.401 | 230117 |
| 2021-11-04 01:51:52 | 574417 | 0.568 | 326269 | 0.406 | 233213 |
| delta | 560 | -0.01 | -5420 | 0.005 | 3096 |
Indeed, the data makes no sense here and there's no way to resolve the conflict. We're supposed to have a devicit of 3096-5420=-2324 votes above, but we're positive 560. Think of total votes like your net worth, and Trump and Biden as the % contributions from two of your bank accounts. I've just handed you a statement that shows that your net worth went up by $560, but individually your accounts are down by $2300. Is this proof of theft? Are you actually richer, or poorer? You can't actually say unless you can account for all the dollars, indluding the negative ones.
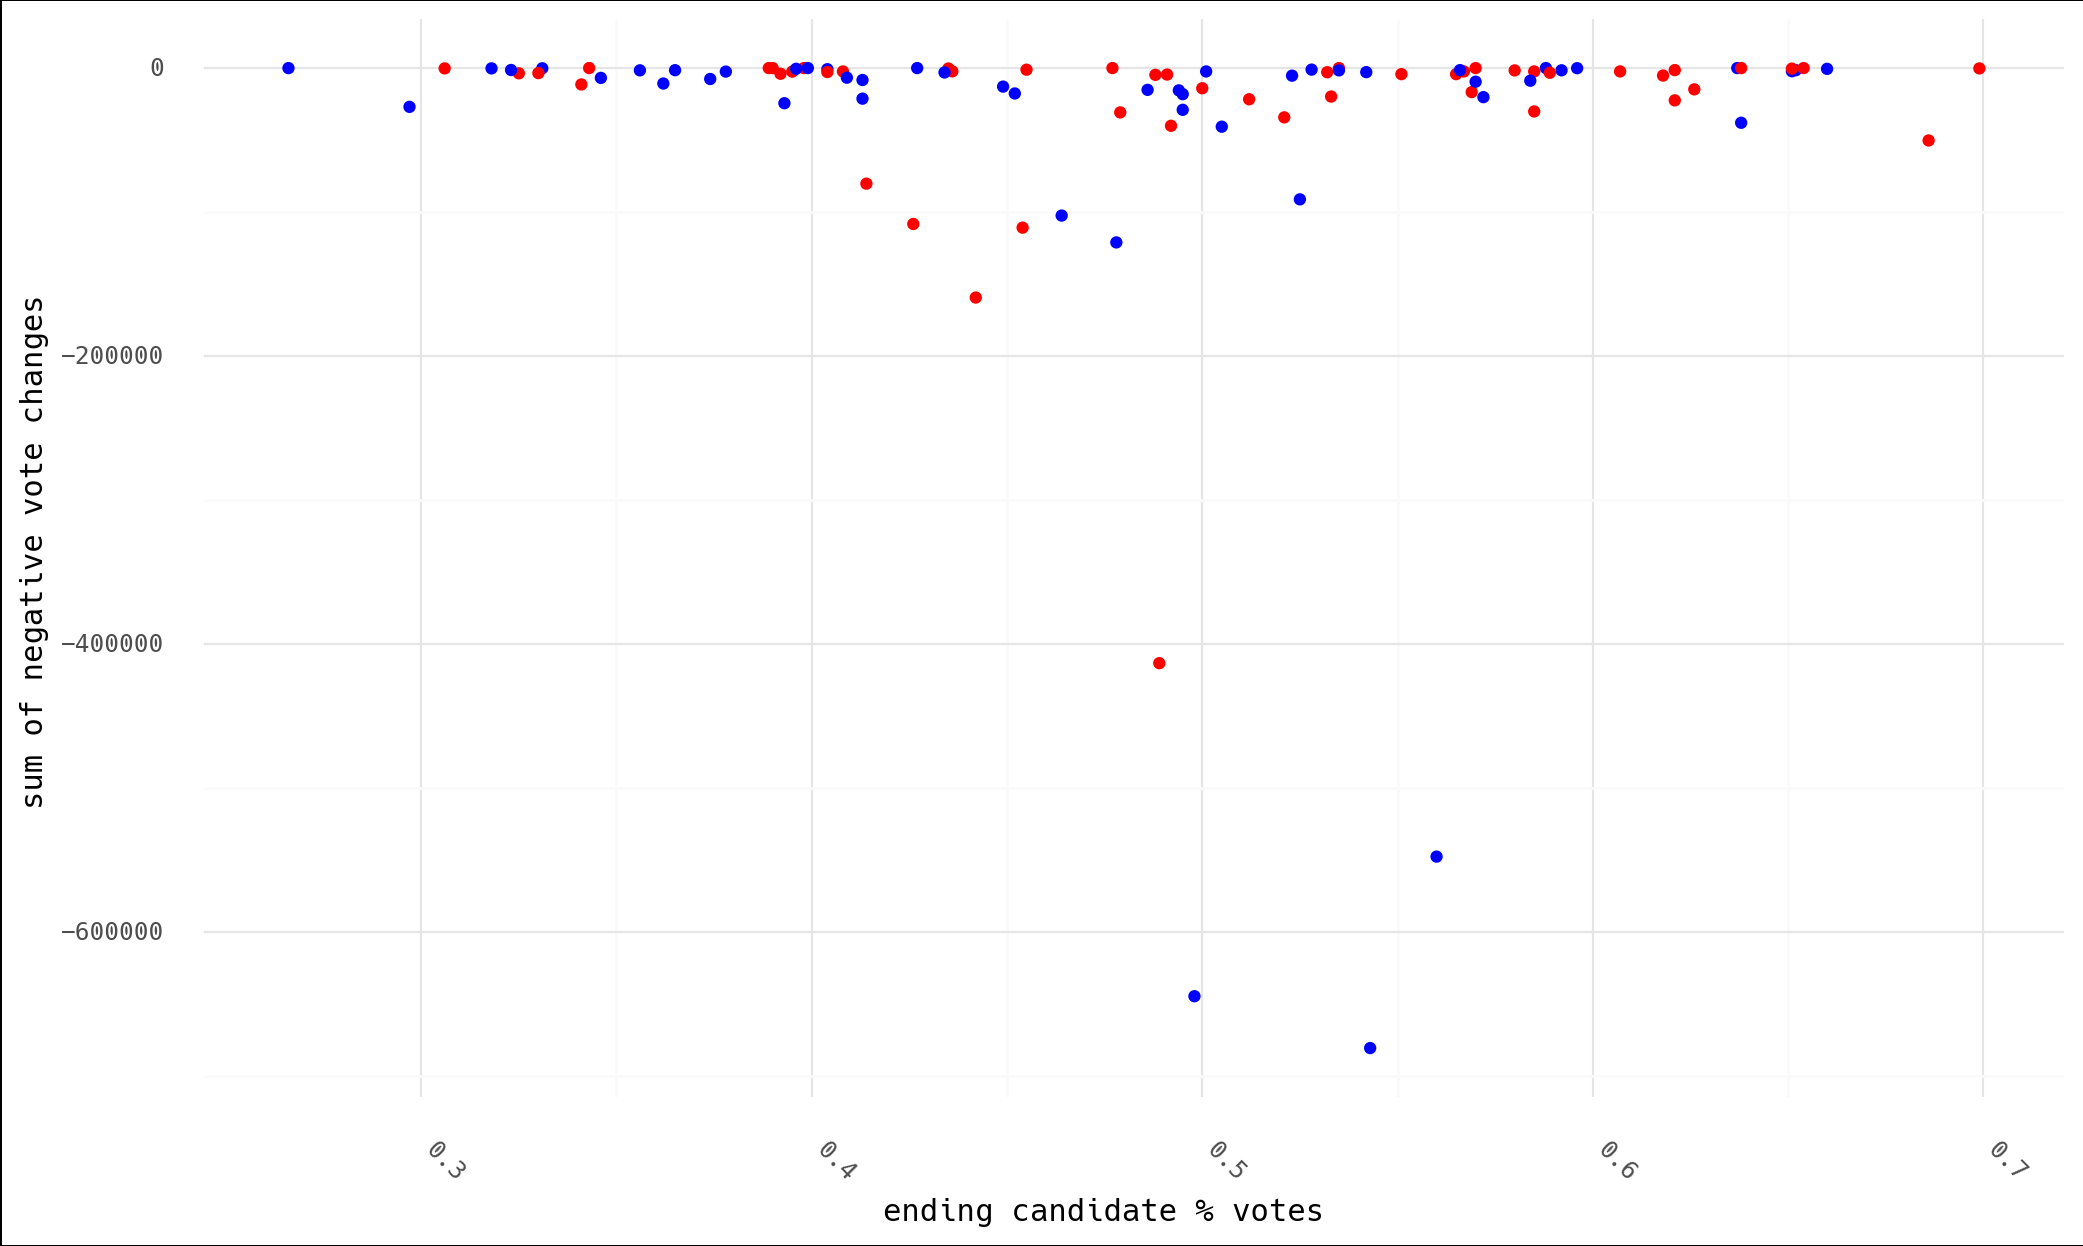
Also realize that the code above used negative values as the catch condition. But how do we differentiate between legitimate positive votes and "corrected" positive votes? Absent of all of this, the best off the cuff hunch you could have is "the account that lost the most probably did worse than the other," right? Except that's not what we find. I've grouped by state and candidate to add up all the "losses" that appear in the data, and plotted vs the final candidate percent (last data point in each timeseries).
Biden "lost" move votes by far, and he also won the states in which these losses occurred.
df_agg = df.groupby(['state', 'cand'], as_index=False).agg({
    'delta': [lambda x: x[x>0].sum(), lambda x: x[x<0].sum()],
    'perc': 'last',
    'votes': 'max',
    'votes_tot': 'last'})
df_agg.columns = ['state', 'cand', 'pos', 'neg', 'perc', 'votes_c', 'votes_tot']

p = ggplot(df_agg, aes(x='perc', y='neg', color='cand')) + geom_point()
p = p + scale_color_manual(breaks=['bidenj', 'trumpd'], values=['blue', 'red'], guide=False)
p = p + scale_y_continuous(name='sum of negative vote changes')
p = p + scale_x_continuous(name='ending candidate % votes')
p = p + theme_minimal() + theme(text=element_text(family='Hack'),
				plot_background=element_rect(fill='white'),
				axis_text_x=element_text(angle=315, hjust=0))
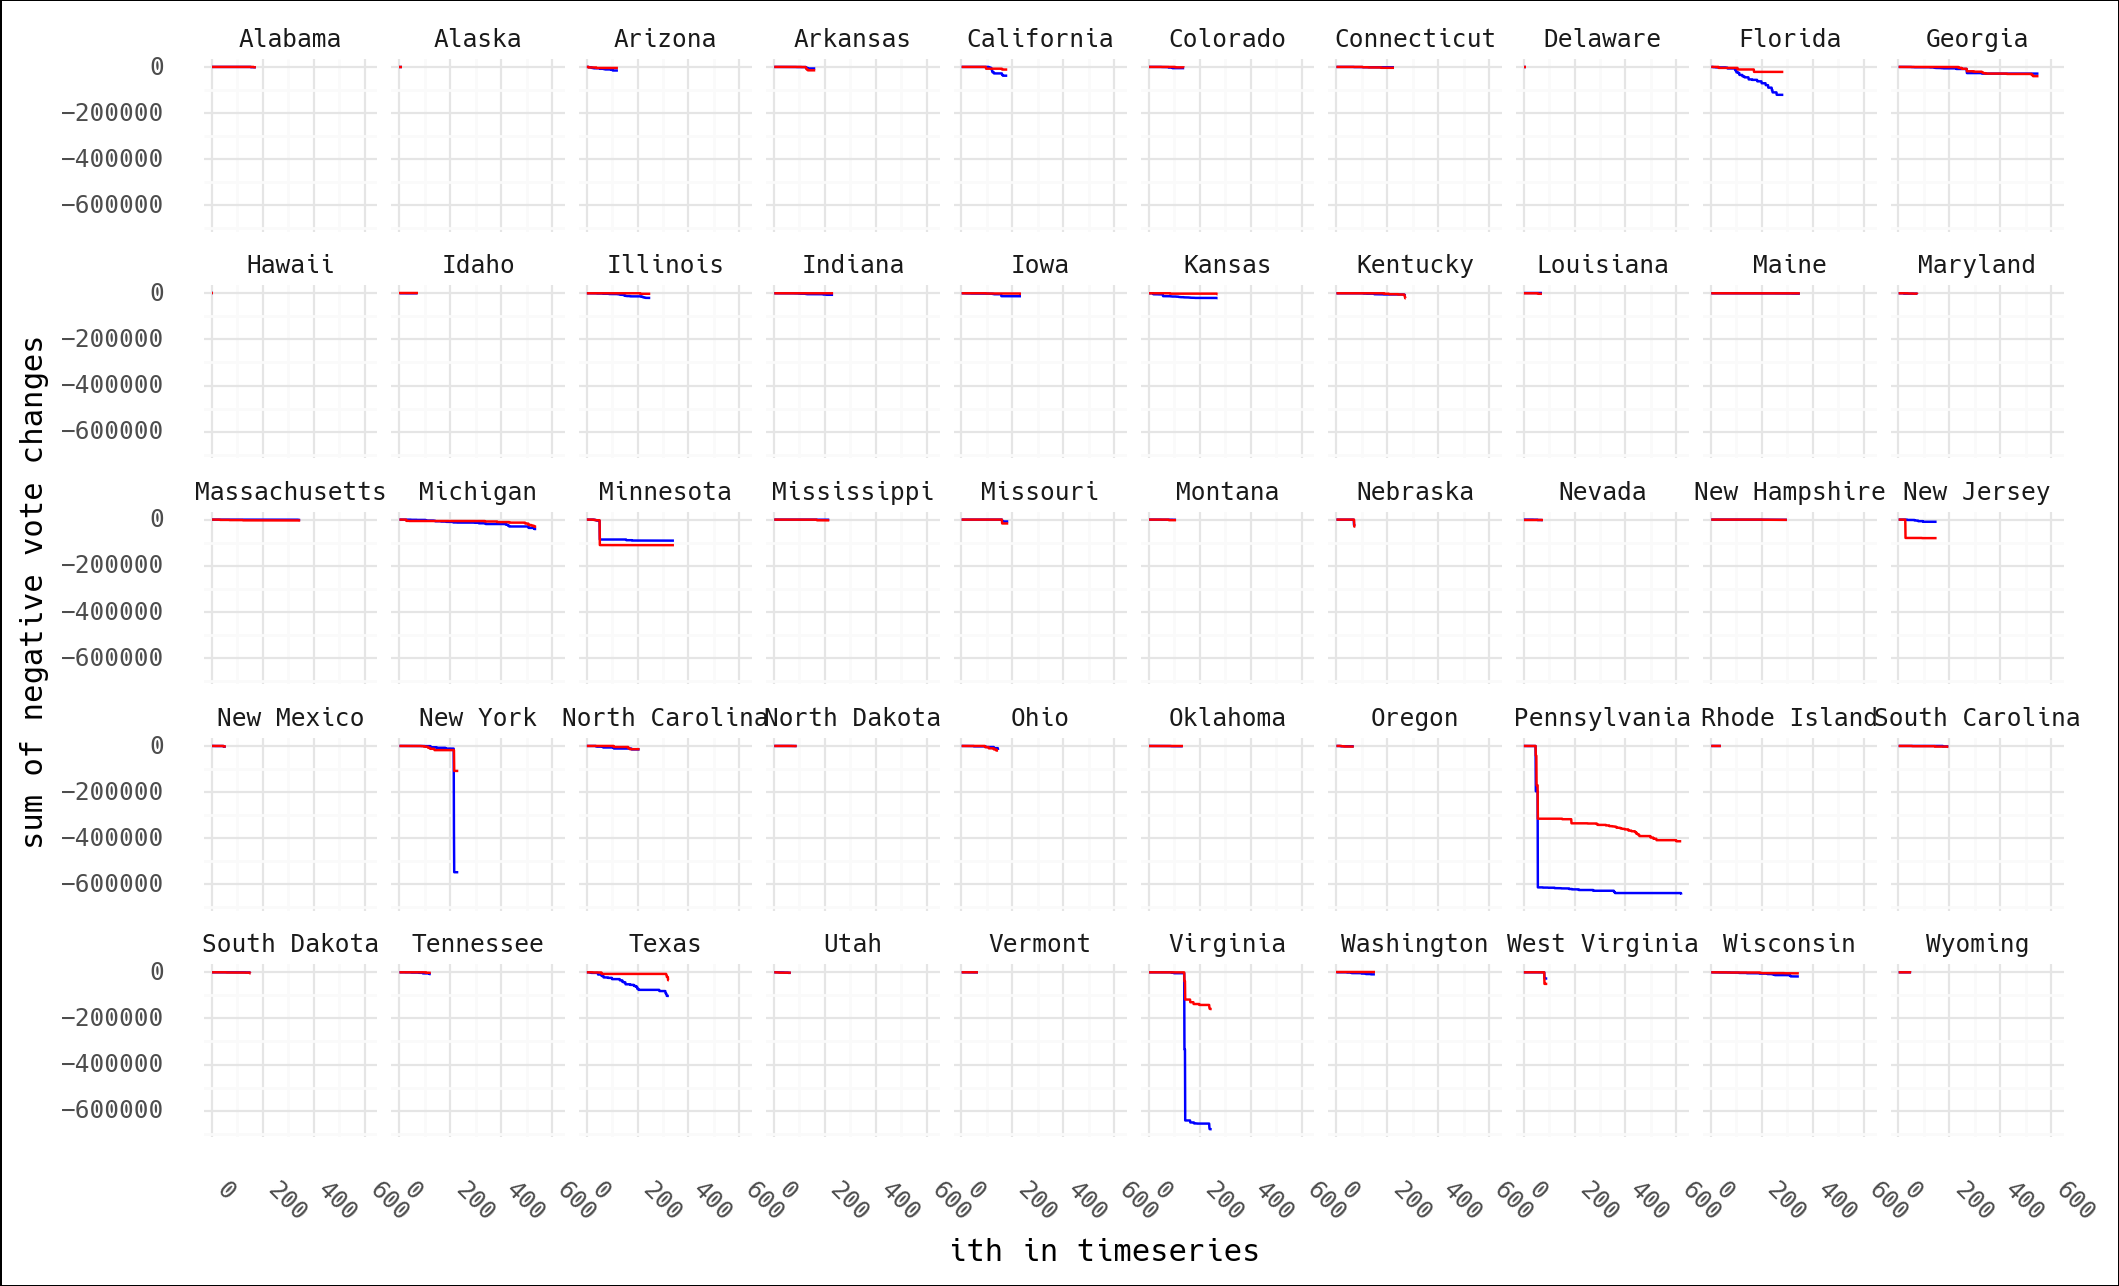
Viewed another way, we can show cumulative "lost" votes vs. time for both candidates by state. As is no surprise, I don't think this fits the narrative.
conclusion
This theory strikes me as the kind of thing wide eyed kids do when they've just had the epiphany that maybe with magnets in just the right positions they could create a perpetual motion machine. A bit of sketchy code on the internet pumped out numbers that said what people wanted to hear, and now this is holy fact etched in stone.
Take a moment to recall what you were actually presented with, not what you thought you saw, or hoped you saw:
- someone told you that New York Times data files were equivalent to official, government records, functioning "like a flight recorder black box"
- code you don't understand and never looked at ran some
if/elselogic and proclaimed that votes were switched and were lost between candidates - these lost votes were presented as having moved from Biden to Trump
Every idea you're presented with is a transaction. Someone's pitching you something in return for your "mental bet." With ideas on the internet, I think it feels like the bet is cheap: "Well, if this is wrong, I still know the overall story is true, even if this thing didn't manage to show it." If you bet wrong, what's the cost? Just move on to another theory, and no one will be tracking you down to pay up on all the comments, tweets, and posts re-circulating this information you ended up being wrong about.
Now, what if someone was selling you this story in exchange for a million dollars to save our country from an aggregious attack against democracy? I mean, aren't those what the stakes really are here? If this is true, soemthing criminally awful happened. Given what you've seen, will you step up materially and tangibly for the cause? Will you find a million dollars, no matter the personal cost, to save our country? If not, consider not betting with your neurons so cheaply, or at least taking a harder look before doing so.